Reshmi Ghosh

Senior Applied Scientist, Microsoft (MSAI)
When the Test Stops Telling the Truth: Evaluations, Benchmark Saturation, and the Metrics We Trust
Posted June 21, 2026
TL;DR
Benchmarks are how the AI field keeps score, but the scoreboard is breaking. Frontier models now sit within a point or two of each other at the top of benchmarks that defined “hard” only a few years ago; the gap between what we measure and what we mean keeps widening; and the single accuracy number on a leaderboard hides brittleness, contamination, and statistical noise. This post walks through why benchmarks saturate, takes a deep dive into the ceiling effect, and then gets concrete about designing better metrics : judging task complexity, stratifying by difficulty, and weighting hard items so the score actually reflects capability. Eight plots are included.
1. Why we benchmark at all
Shared benchmarks gave machine learning its empirical engine. ImageNet [1] turned computer vision into a measurable race; GLUE [2] and SuperGLUE [3] did the same for natural language understanding. A good benchmark is a coordination device: it lets independent labs compare systems on common ground and turns vague claims (“our model understands language”) into falsifiable numbers.
The catch is that a benchmark is only ever a proxy for the capability we actually care about. As Raji et al. argue in “AI and the Everything in the Whole Wide World Benchmark” [4], we routinely treat narrow, task-specific datasets as if they measured general ability. That proxy gap is the seed of every problem below.
2. Saturation, and a deep dive into the ceiling effect
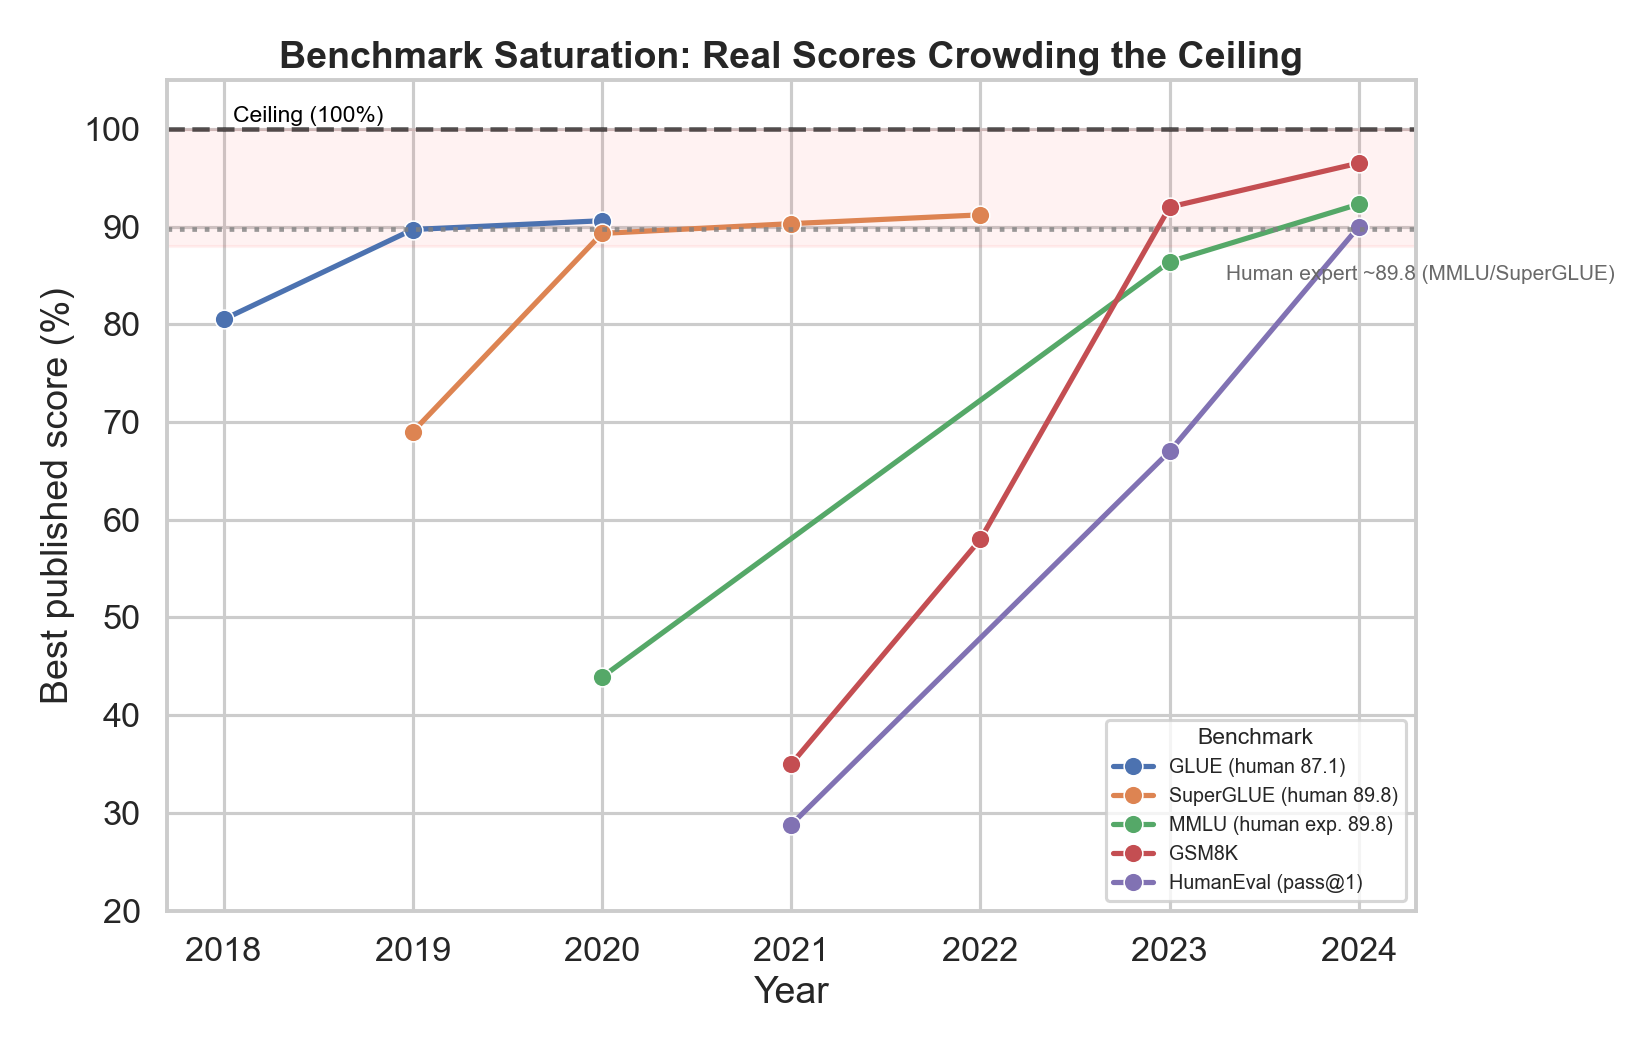
Figure 1. Best published scores per year for GLUE, SuperGLUE, MMLU [5], GSM8K [6], and HumanEval [7] all bend toward 100%. MMLU went from GPT-3’s 43.9% in 2020 [5] to GPT-4’s 86.4% in 2023 and 92.3% (o1) in 2024; GSM8K rose from roughly 35% (2021) through PaLM’s 58% with chain-of-thought (2022) [8] to ~92% (GPT-4, 2023) and ~97% (2024); HumanEval climbed from Codex’s 28.8% (2021) [7] to ~90% (2024). GLUE’s non-expert human baseline of 87.1 was passed in 2019; SuperGLUE’s 89.8 fell to DeBERTa’s 90.3 in January 2021 [3].
2.1 What the ceiling effect actually is
A ceiling effect occurs when scores bunch against the maximum of the scale, so the instrument can no longer separate the things it measures. Once the best model scores 92% and the next scores 91%, the one-point gap is mostly measurement noise, not a real capability difference.
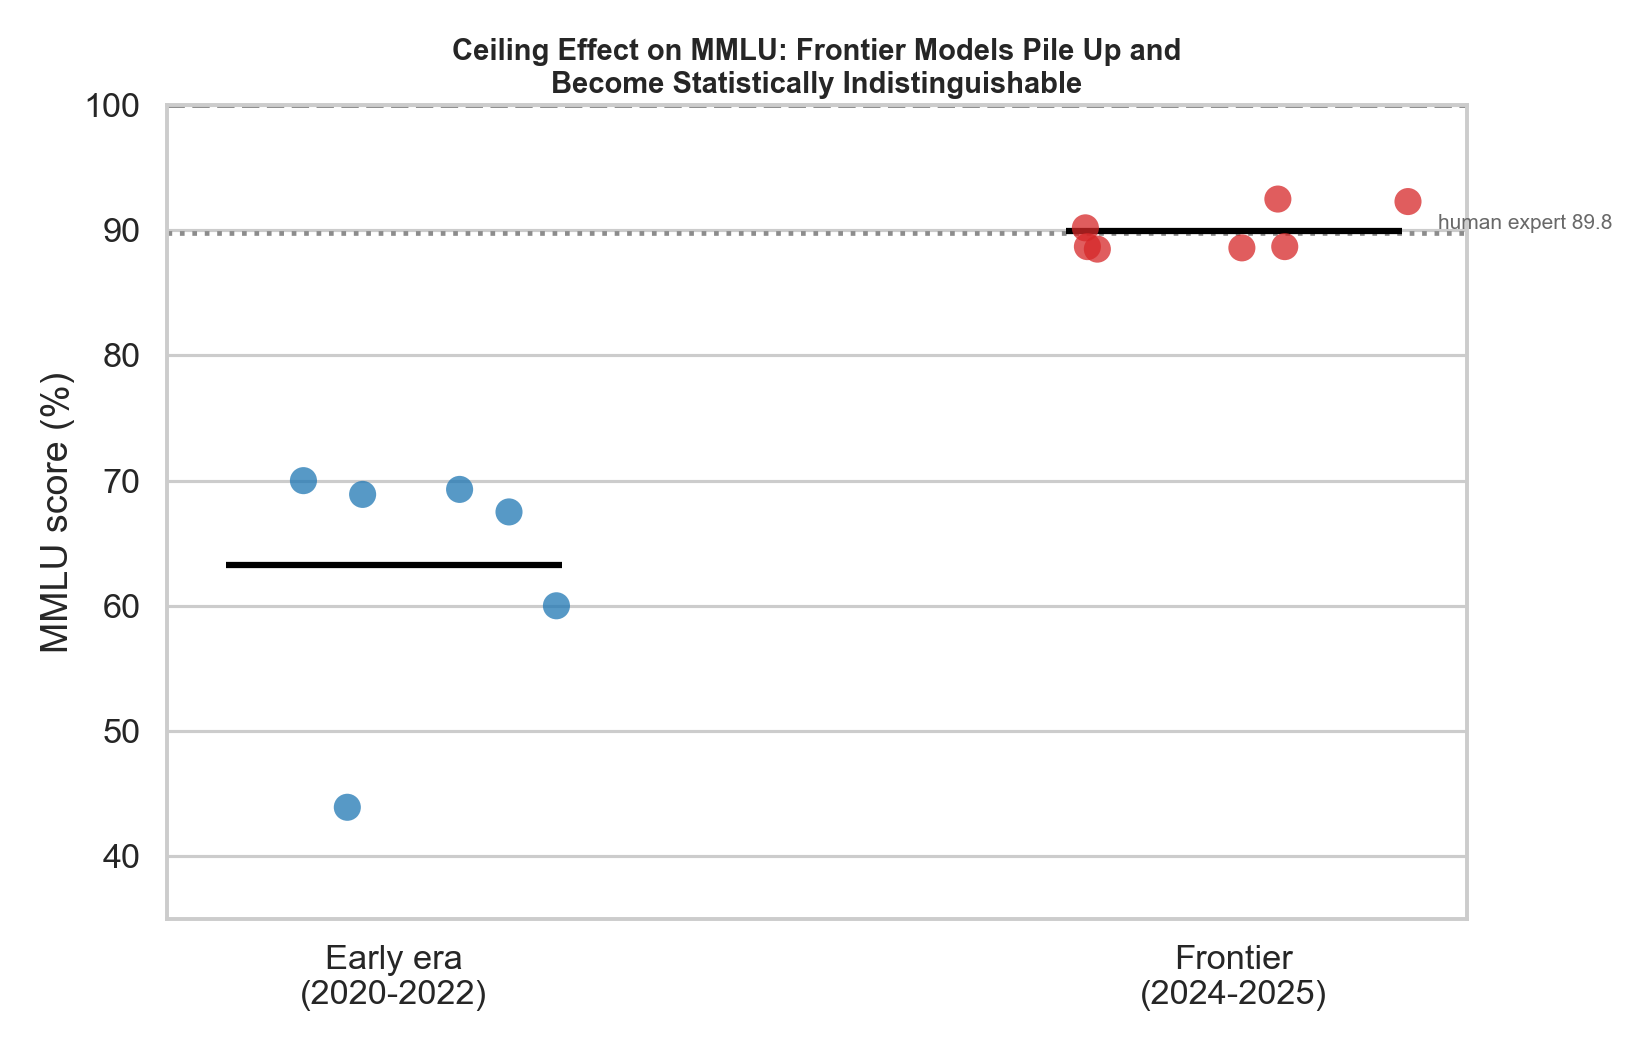
Figure 2. This is the saturation story at a single moment. In 2020–2022, MMLU scores were spread across a wide, informative range (GPT-3 43.9, Gopher 60.0, Chinchilla 67.5, PaLM 69.3, GPT-3.5 ~70). By 2024–2025 the frontier is a tight cluster — DeepSeek-V3 88.5, GPT-4o 88.7, Claude 3.5 Sonnet 88.7, Llama-3.1-405B 88.6, GPT-4.1 90.2, o1 92.3, GPT-5 92.5 — all hugging the human-expert line (89.8). The benchmark has lost most of its power to rank these systems.
2.2 Why the ceiling arrives sooner than you’d think: the noise ceiling
The effective ceiling is below 100%, because benchmarks contain mislabeled or ambiguous items. The audit “Are We Done with MMLU?” [9] found that a meaningful fraction of MMLU questions contain errors, in some subsets (e.g., Virology) a large share of sampled questions were flawed. When ~6%+ of the gold labels are wrong, a “95%” is statistically indistinguishable from a “perfect” model: both are at the noise ceiling. Past that point you are largely measuring who best fits the errors in the test set — the opposite of progress.
2.3 Why averages make it worse
A single mean compresses the tail. As a benchmark saturates, almost all the remaining signal lives in a small number of hard items, but those items are diluted by a large mass of easy ones everyone already solves. The aggregate moves by tenths of a percent while the interesting differences — on the hard tail — get averaged away. (Section 5 is the fix: stop averaging naively.)
2.4 The treadmill
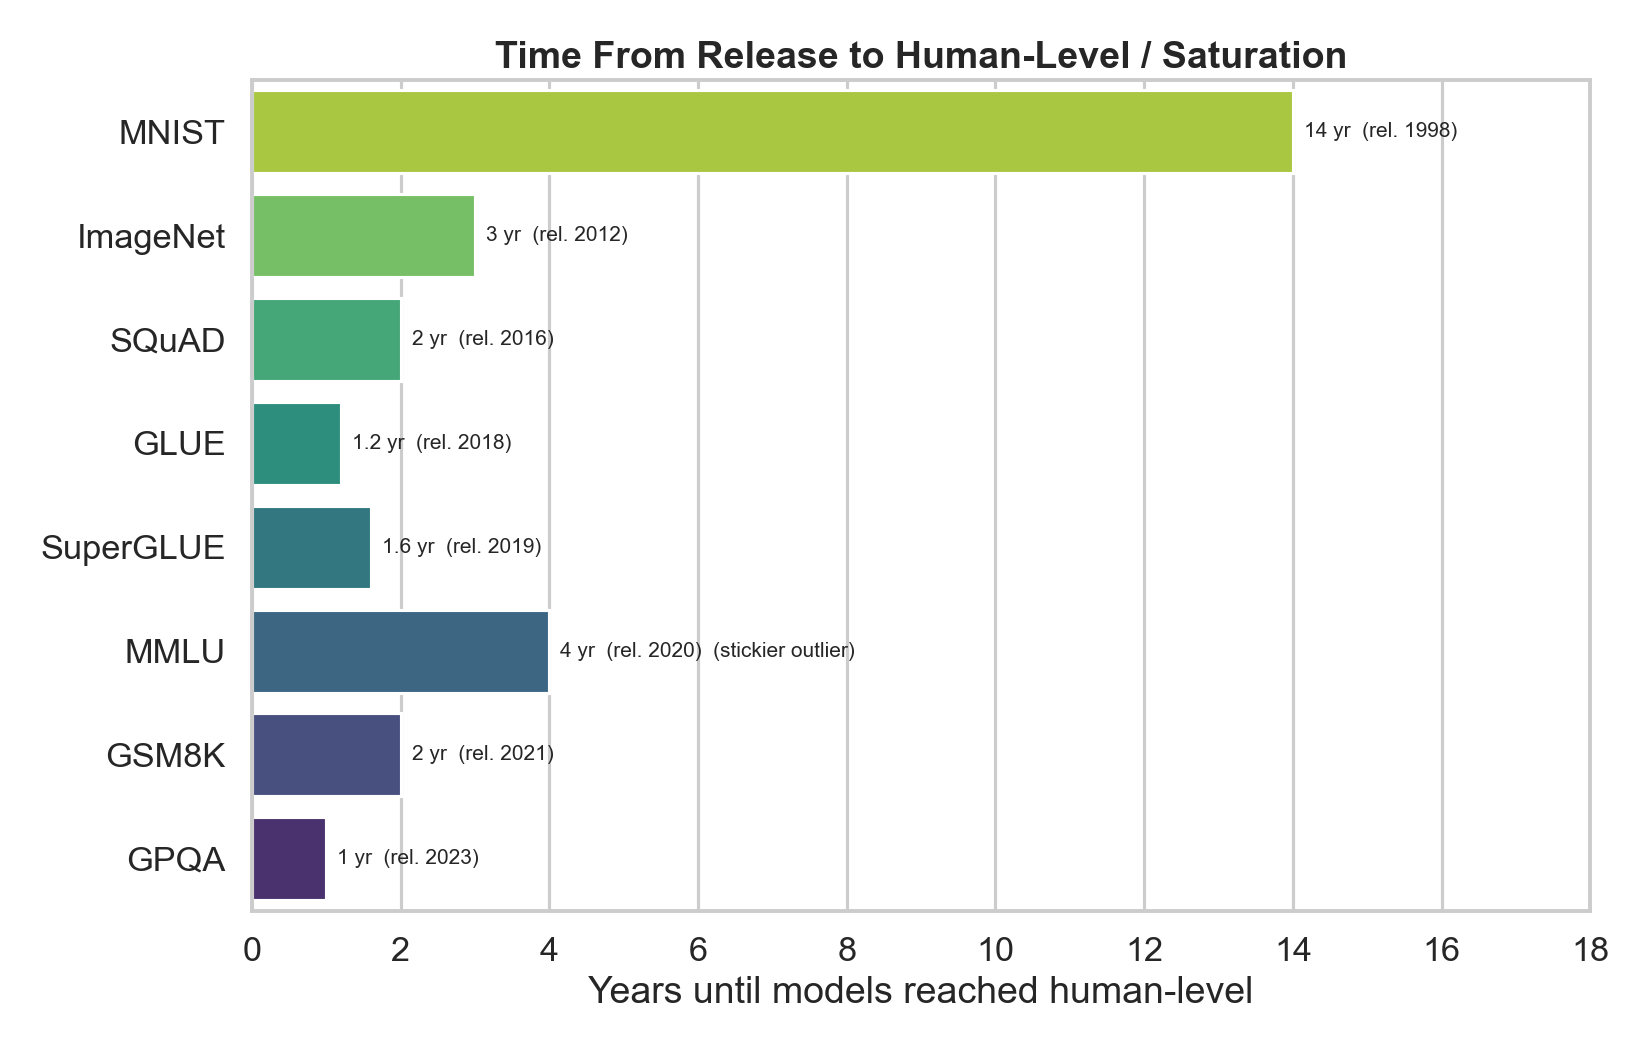
Figure 3. The time from a benchmark’s release to models reaching human-level has compressed dramatically: MNIST took ~14 years, ImageNet ~3 (ResNet surpassing the human error rate around 2015 [10]), SQuAD ~2, GLUE ~1.2, SuperGLUE ~1.6, GSM8K ~2, GPQA [11] ~1. MMLU is the stickier outlier at ~4 years — harder, broader benchmarks resist saturation longer, which is exactly the design lesson. Each new frontier suite — ARC-AGI [12], GPQA [11], SWE-bench [13], FrontierMath, Humanity’s Last Exam — buys a little more time than the last, but the treadmill keeps moving.
3. Goodhart’s Law: optimizing the proxy
“When a measure becomes a target, it ceases to be a good measure.” — Marilyn Strathern’s paraphrase of Goodhart [14]
Once a benchmark becomes the target of optimization — through architecture, data curation, or fine-tuning — it stops faithfully tracking the underlying capability. The most direct (and often unintentional) route to a high score is data contamination: test examples leaking into pretraining [15].
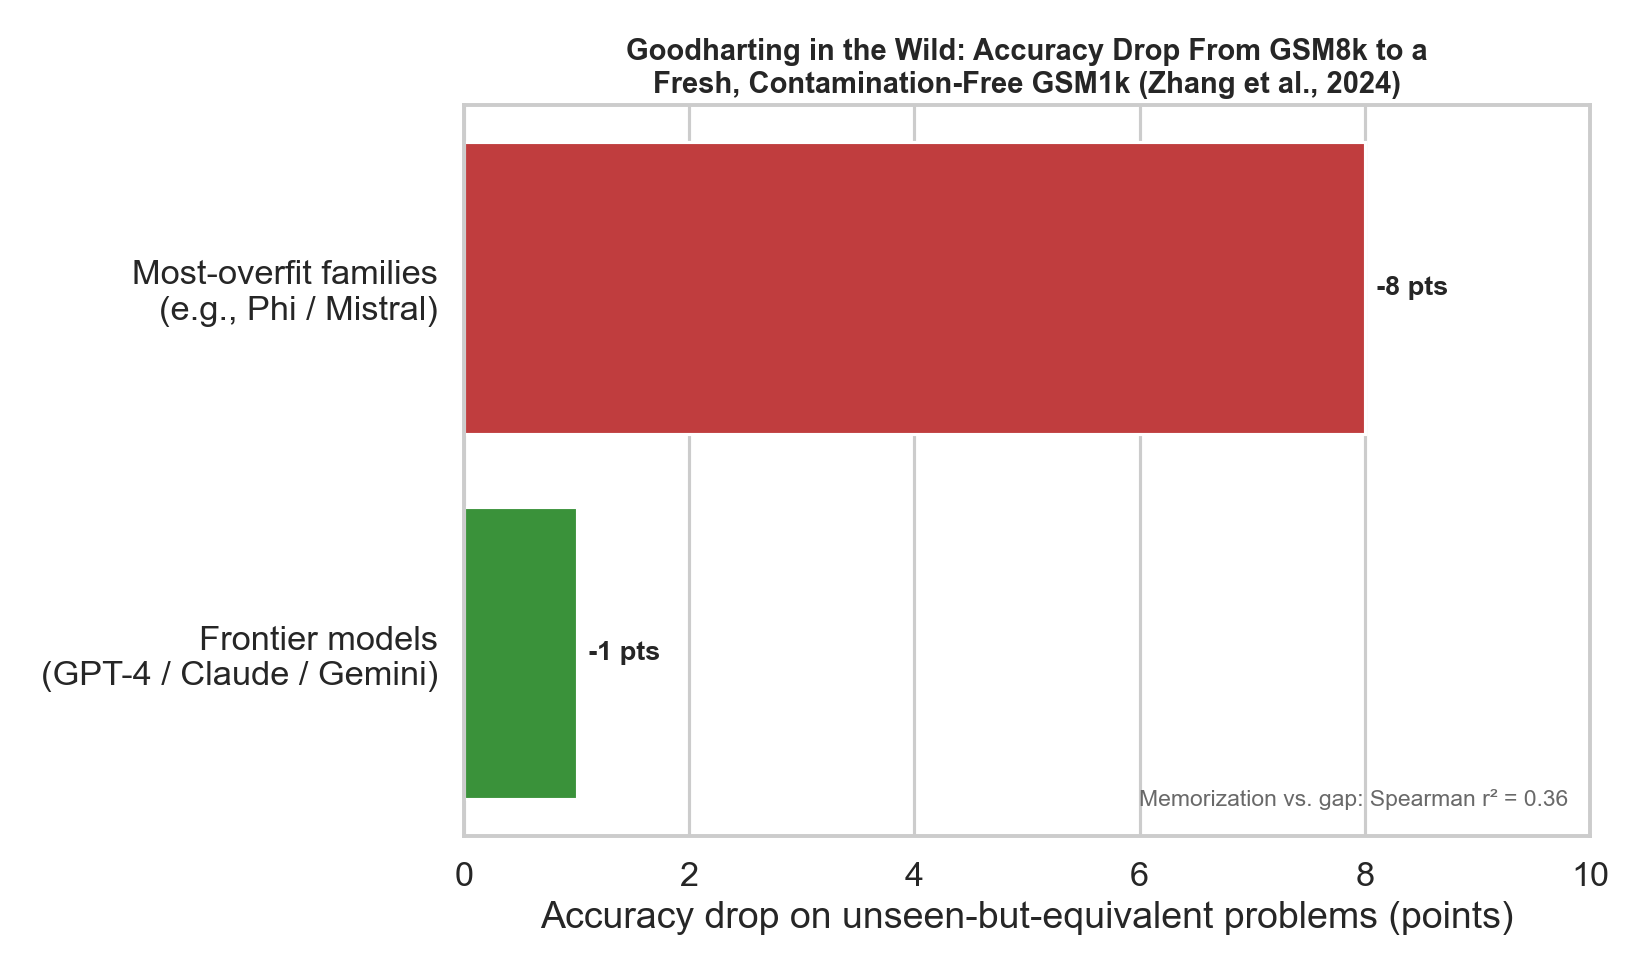
Figure 4. A clean real-world demonstration: Scale AI’s GSM1k [16] re-created GSM8K’s style and difficulty as a fresh, unseen test. Evaluated on it, the most overfit model families (notably Phi and Mistral variants) dropped by up to ~8 points, while frontier models (GPT-4, Claude, Gemini) dropped minimally. The paper found a positive relationship (Spearman’s r² = 0.36) between a model’s probability of generating GSM8K examples and its GSM8K→GSM1k gap — i.e., the models that look like they memorized the test are the ones whose scores were inflated. That is Goodharting, measured.
4. The metric itself is a modeling choice
Even setting saturation and contamination aside, a single headline number throws away most of what matters.
4.1 Brittleness and variance
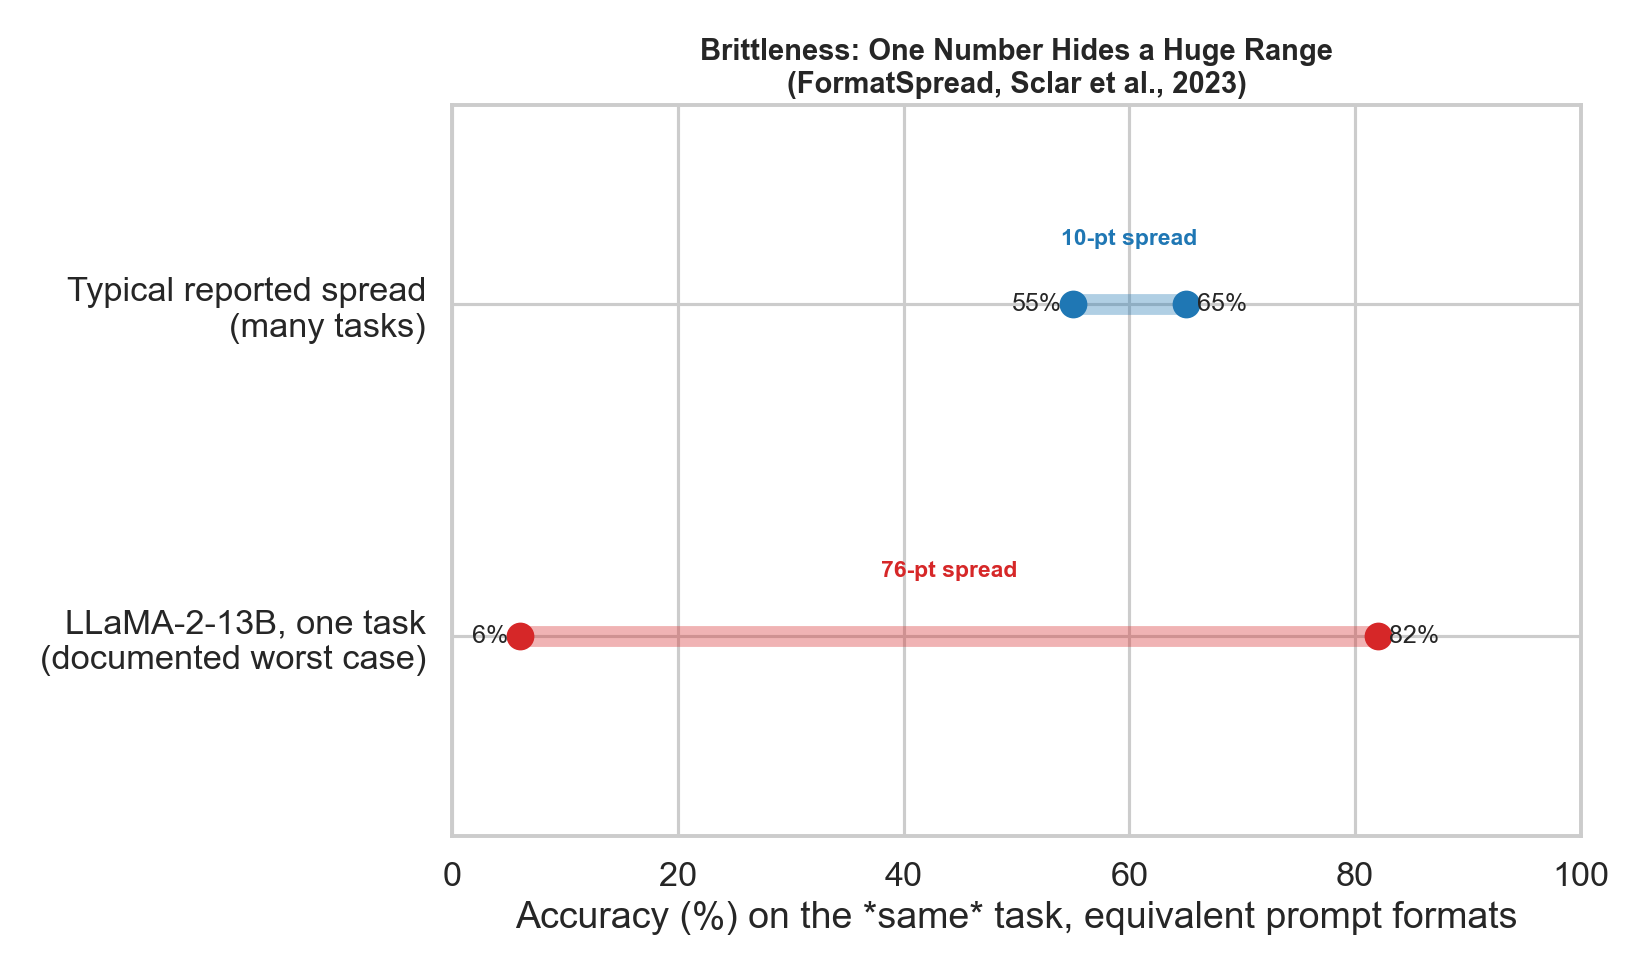
Figure 5. Run the same model on the same task under semantically-equivalent prompt formats and the “accuracy” becomes a distribution, not a point. Sclar et al.’s FormatSpread study [17] documented spreads as large as 76 accuracy points from formatting alone — e.g., a single LLaMA-2-13B task swinging from ~6% to ~82%. A leaderboard cell of “70%” may silently mean “anywhere from 55% to 85% depending on whitespace and punctuation.” Good practice, too often skipped, is to report confidence intervals, variance across seeds/prompts, and significance tests for the gaps between models.
4.2 Construct validity: are we measuring what we claim?
Borrowed from psychometrics, construct validity asks whether a test actually measures the thing it purports to [18]. Does MMLU measure reasoning, or memorized facts? Does a coding benchmark measure software engineering, or pattern-matching to common snippets? Jacobs & Wallach [18] give a rigorous framework; most ML benchmarks never apply it.
4.3 Aggregation hides failure modes
A strong average can coexist with systematic failure on a subgroup, a language, or an adversarial slice. Holistic frameworks like HELM [19] push back by reporting many metrics (accuracy, calibration, robustness, fairness, bias, toxicity, efficiency) across many scenarios — treating evaluation as multidimensional rather than scalar.
4.4 Metric–goal mismatch
Exact-match scoring penalizes correct answers phrased differently; n-gram metrics like BLEU/ROUGE correlate weakly with human judgments for open-ended generation. The metric you can compute cheaply is frequently not the metric you care about.
5. Designing better metrics: complexity, stratification, and weighting
If naive accuracy is the problem, what does a well-designed metric look like? The throughline is simple: not all items are worth the same, so don’t score them as if they were.
5.1 First, let the metric judge task complexity
You can’t weight by difficulty until you can estimate difficulty. Practical signals, several of them validated when GSM1k was constructed to match GSM8K [16]:
- Human solve rate — the fraction of people (or time) needed to solve an item.
- Solution length / number of reasoning steps — more steps generally means harder.
- Answer/operand magnitude or branching factor — structural complexity.
- Model-derived difficulty — how many models, or how many samples, solve it (empirical pass-rate as a difficulty proxy).
- Discrimination — does the item separate strong from weak systems, or do all models get it right/wrong? (Formalized by IRT, §5.4.)
Tag every item with a difficulty estimate before aggregating. The tag is what makes everything below possible.
5.2 Difficulty stratification: report per-stratum, not just the mean
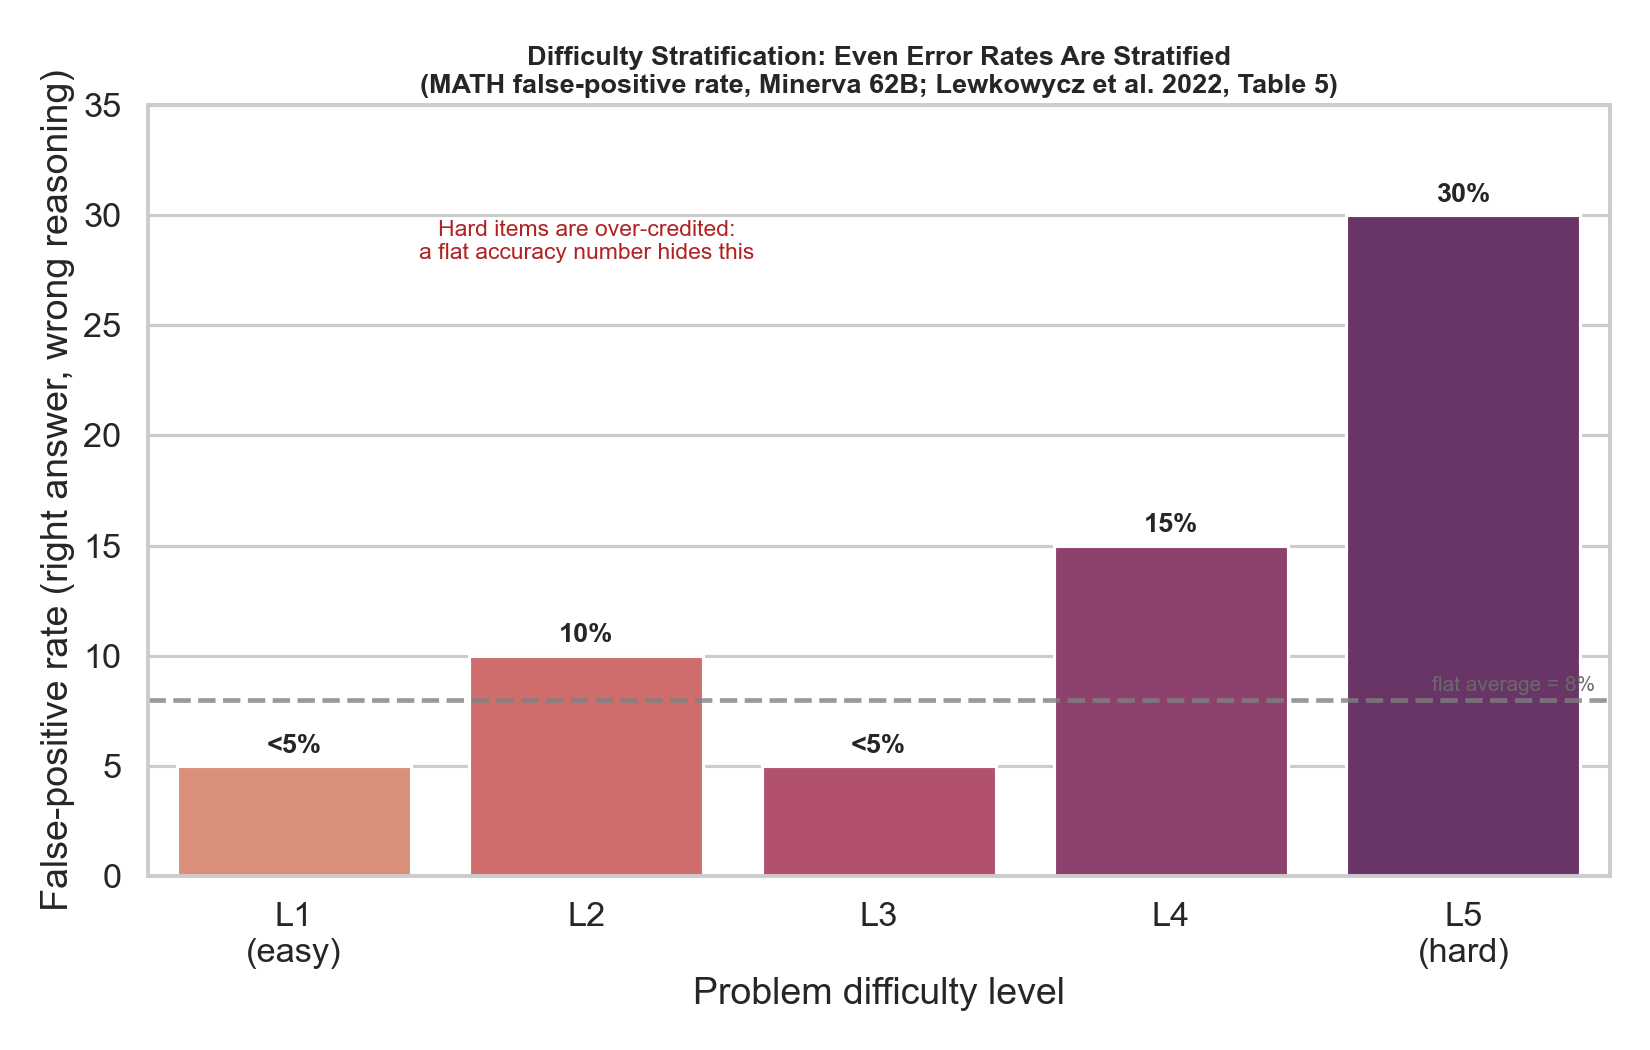
Figure 6. The Minerva authors stratified MATH by difficulty and reported an exact per-level breakdown of the model’s false-positive rate — cases where the final answer is right but the reasoning is wrong [20, Table 5]. It climbs monotonically with difficulty, from under 5% on Level-1 problems to 30% on Level-5 (flat average: 8%). The implication is sharp: a single accuracy number increasingly over-credits the hardest items, exactly where you most want it to be trustworthy. (Tellingly, the paper tabulates accuracy by subtopic and model scale, but not a clean accuracy-by-level table — so beware second-hand “per-level accuracy” numbers; several circulating versions are fabricated.) Per-stratum reporting, each band scored on its own metric with its own confidence interval, restores the signal a saturated aggregate destroys, and makes ceiling effects visible (easy strata saturate first; hard strata stay discriminative far longer).
5.3 Weighting and aggregated scoring: make hard items worth more
Once items are stratified, you can aggregate deliberately instead of by accident:
- Difficulty-weighted scoring. Give item i a weight wᵢ that rises with difficulty, and report Σ wᵢ·correctᵢ / Σ wᵢ. Hard problems move the score more.
- Macro- vs micro-averaging. Average within each stratum/category first, then across strata (macro), so a flood of easy items can’t dominate a few hard ones (micro). Macro-averaging is itself a form of importance weighting.
- Partial credit. For multi-step tasks, award graded credit for partial solutions rather than all-or-nothing — more informative and less noisy.
- Guess-rate correction. Normalize multiple-choice scores for the random baseline (e.g., chance-correct on 4-way MCQ is 25%), so “above chance” is what is actually rewarded.
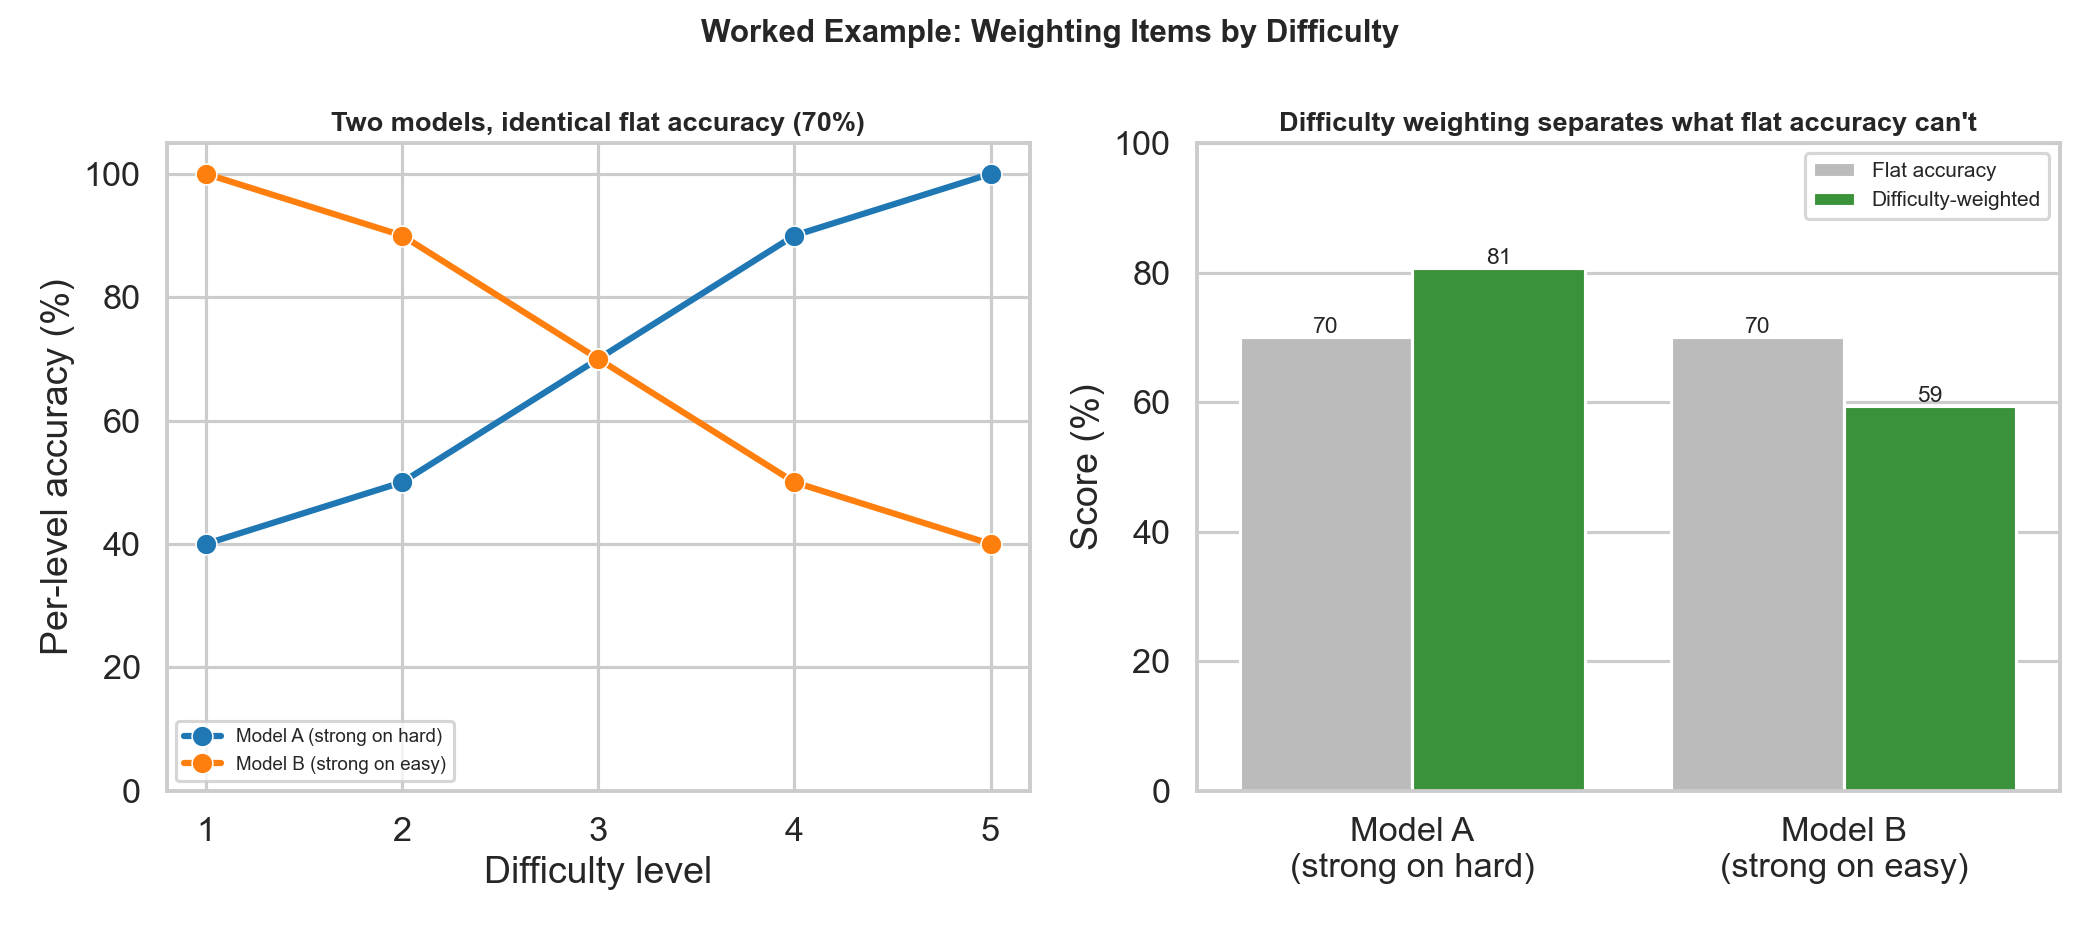
Figure 7 (worked example). Two models have identical 70% flat accuracy, but opposite difficulty profiles: Model A nails the hard items and misses easy ones; Model B is the reverse. Flat accuracy calls them equal. A difficulty-weighted score (harder items worth more) separates them cleanly — 81% vs 59% — surfacing the capability that flat accuracy erased. The weighting choice is a statement about what you value; make it explicitly, not by accidentally treating all items as equal.
⚠️ A caution: weighting introduces a knob that can itself be gamed or mis-specified. Publish the weighting scheme, justify it (ideally from human solve rates or IRT, not vibes), and run sensitivity analysis so the ranking doesn’t hinge on an arbitrary curve.
5.4 The principled version: Item Response Theory (IRT)
Psychometrics solved a version of this problem decades ago. Item Response Theory models each item with parameters — typically difficulty and discrimination (and sometimes a guessing parameter) — and each test-taker with a latent ability θ. A correct answer on a hard, discriminative item is worth more evidence about θ than a correct answer on an easy one. Applied to ML leaderboards [21, 22], IRT:
- Yields an ability score that is difficulty-aware by construction.
- Identifies non-discriminative items (everyone right or everyone wrong) that add cost but no signal — letting you prune saturated questions.
- Enables tiny, efficient benchmarks: because items are weighted by information, a small IRT-selected subset can estimate ability nearly as well as the full set (the idea behind tinyBenchmarks [23]).
IRT is essentially §5.1–5.3 done rigorously: estimate difficulty and discrimination from data, then score ability rather than raw accuracy.
5.5 Always attach uncertainty
Whatever you aggregate, report it with confidence intervals and variance across seeds and prompts (recall §4.1), and run a significance test before claiming model X beats model Y. Near the ceiling, most headline gaps don’t survive this — which is precisely the point.
6. LLM-as-judge: scalable, but biased
To escape rigid string-matching, the field increasingly uses LLMs as judges of open-ended outputs (e.g., MT-Bench) [24]. It scales beautifully — and imports biases.
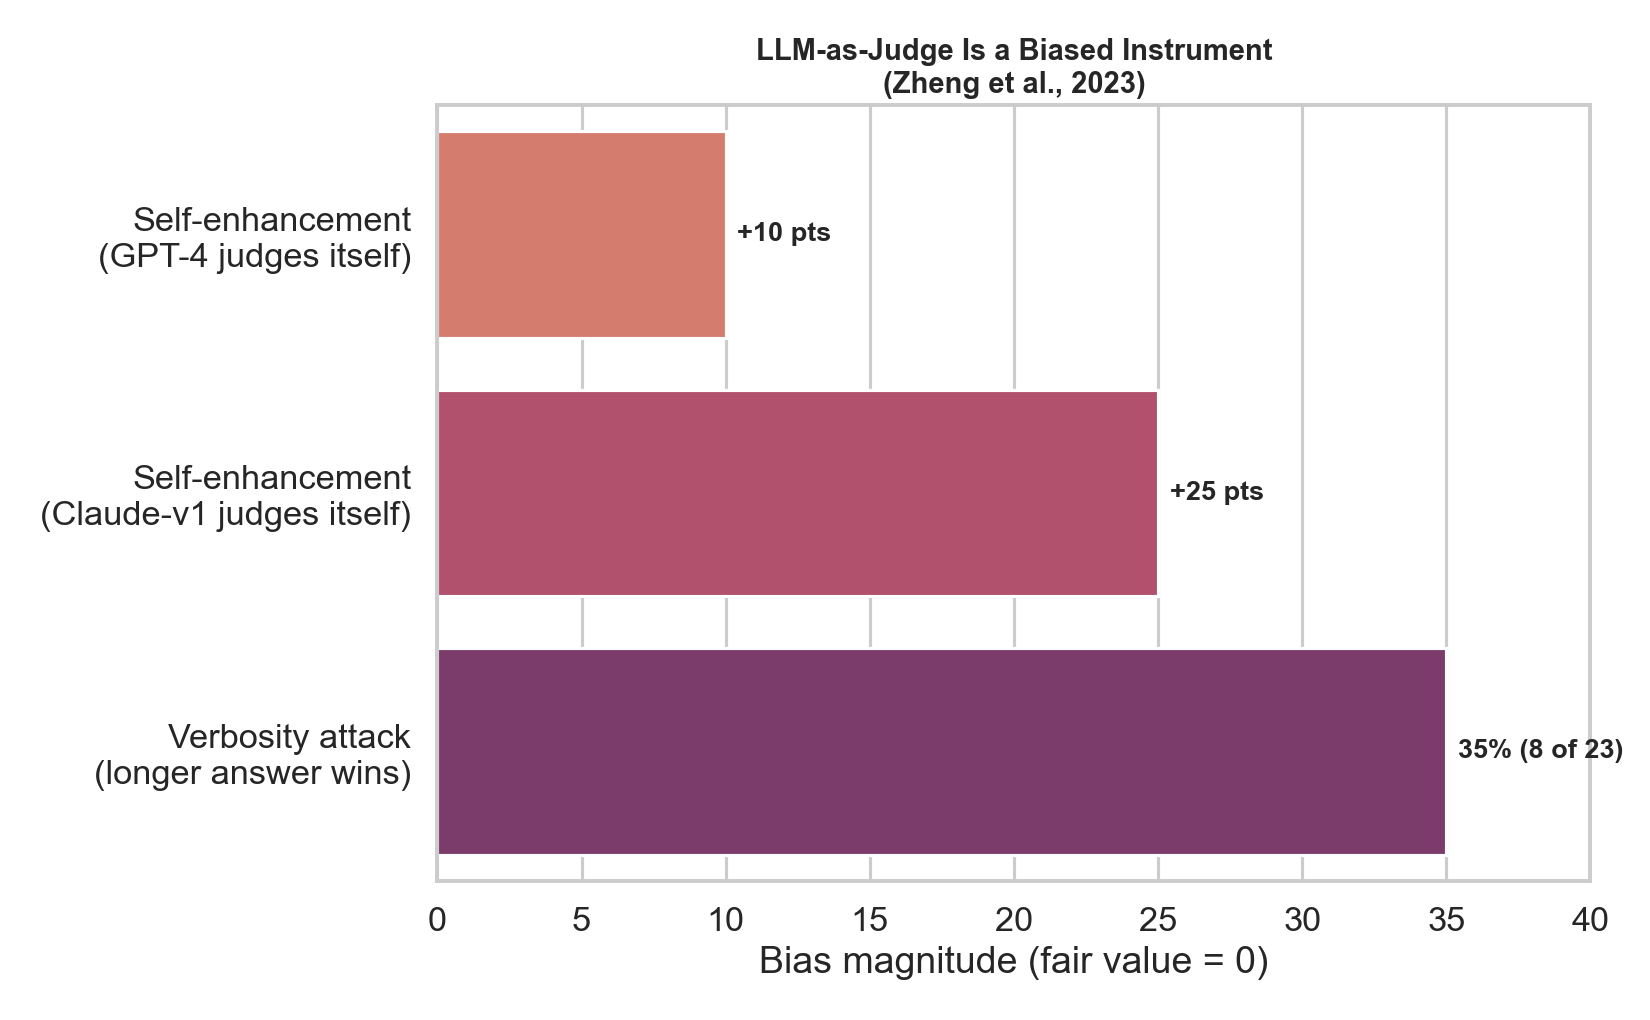
Figure 8. Real numbers from Zheng et al. [24]: self-enhancement bias — GPT-4 favors its own answers by ~10 percentage points of win rate, and Claude-v1 by ~25, and a verbosity attack in which simply making an answer longer/repetitive won in 8 of 23 cases (~35%) it shouldn’t have. There is also position bias (order-dependence), mitigated by swapping positions and averaging. Mitigations exist (position-swapping, calibrating against human labels, juries of multiple judges), but “LLM-as-judge” is a measuring instrument that itself needs validation.
7. Toward evaluations that don’t break
- Living / dynamic benchmarks. Dynabench [25] collects human-adversarial examples in the loop, so the test moves as models improve.
- Private, rotating, contamination-resistant test sets (the GSM1k lesson [16]).
- Harder, reasoning-heavy suites that resist memorization: GPQA [11], ARC-AGI [12], FrontierMath.
- Task-grounded, agentic evaluation like SWE-bench [13] — resolving real GitHub issues against real test suites, outcome-based not trivia-based.
- Human preference at scale: Chatbot Arena [26] (pairwise votes, Elo), with awareness of its own style/length biases.
- Holistic, multi-metric, difficulty-aware reporting — HELM [19] breadth plus the stratification/weighting/IRT machinery of Section 5, always with uncertainty.
- Separate capability evals from safety/alignment evals.
8. The mindset shift
The deepest fix is cultural: treat evaluation as a first-class engineering and scientific discipline. Versioned eval sets, documented construct definitions, difficulty-tagged items, weighted/stratified scoring, contamination audits, reported variance — and a standing assumption that any single number is probably lying to you a little. Benchmarks didn’t fail us; we asked one number to carry more meaning than one number can hold.
References
- Deng et al. (2009). ImageNet: A Large-Scale Hierarchical Image Database. CVPR.
- Wang et al. (2018). GLUE: A Multi-Task Benchmark and Analysis Platform for Natural Language Understanding. arXiv:1804.07461. (Human baseline 87.1.)
- Wang et al. (2019). SuperGLUE: A Stickier Benchmark for General-Purpose Language Understanding Systems. arXiv:1905.00537. (Human baseline 89.8.)
- Raji et al. (2021). AI and the Everything in the Whole Wide World Benchmark. NeurIPS Datasets & Benchmarks. arXiv:2111.15366.
- Hendrycks et al. (2021). Measuring Massive Multitask Language Understanding (MMLU). ICLR. arXiv:2009.03300. (GPT-3 43.9%; human expert ~89.8%.)
- Cobbe et al. (2021). Training Verifiers to Solve Math Word Problems (GSM8K). arXiv:2110.14168.
- Chen et al. (2021). Evaluating Large Language Models Trained on Code (HumanEval). arXiv:2107.03374. (Codex pass@1 28.8%.)
- Wei et al. (2022). Chain-of-Thought Prompting Elicits Reasoning in Large Language Models. arXiv:2201.11903. (PaLM 540B + CoT ~58% on GSM8K.)
- Gema et al. (2024). Are We Done with MMLU? arXiv:2406.04127. (Label errors in MMLU.)
- He et al. (2015). Deep Residual Learning for Image Recognition (ResNet). arXiv:1512.03385. (Surpassing human-level ImageNet error.)
- Rein et al. (2023). GPQA: A Graduate-Level Google-Proof Q&A Benchmark. arXiv:2311.12022.
- Chollet (2019). On the Measure of Intelligence (ARC). arXiv:1911.01547.
- Jimenez et al. (2023). SWE-bench: Can Language Models Resolve Real-World GitHub Issues? arXiv:2310.06770.
- Strathern (1997). ‘Improving ratings’: audit in the British University system. European Review, 5(3). (Popular phrasing of Goodhart’s Law.)
- Sainz et al. (2023). NLP Evaluation in Trouble: On the Need to Measure LLM Data Contamination for Each Benchmark. Findings of EMNLP. arXiv:2310.18018.
- Zhang et al. (2024). A Careful Examination of Large Language Model Performance on Grade School Arithmetic (GSM1k). arXiv:2405.00332. (Drops up to ~8%; frontier minimal; Spearman r² = 0.36.)
- Sclar et al. (2023). Quantifying Language Models’ Sensitivity to Spurious Features in Prompt Design (FormatSpread). arXiv:2310.11324. (Spreads up to ~76 points.)
- Jacobs & Wallach (2021). Measurement and Fairness. FAccT. arXiv:1912.05511.
- Liang et al. (2022). Holistic Evaluation of Language Models (HELM). arXiv:2211.09110.
- Lewkowycz et al. (2022). Solving Quantitative Reasoning Problems with Language Models (Minerva). arXiv:2206.14858. (Table 5: MATH false-positive rate by difficulty level for Minerva 62B — L1 <5%, L2 10%, L3 <5%, L4 15%, L5 30%, avg 8%. The paper reports MATH accuracy by subtopic and model scale, not a per-difficulty-level accuracy table.)
- Lalor et al. (2016). Building an Evaluation Scale using Item Response Theory. EMNLP. arXiv:1605.08889.
- Rodriguez et al. (2021). Evaluating the Evaluation of Diversity / QA Leaderboards with Item Response Theory. ACL. arXiv:2106.00840.
- Polo et al. (2024). tinyBenchmarks: Evaluating LLMs with Fewer Examples. ICML. arXiv:2402.14992.
- Zheng et al. (2023). Judging LLM-as-a-Judge with MT-Bench and Chatbot Arena. NeurIPS. arXiv:2306.05685. (Self-enhancement +10%/+25%; verbosity 8/23.)
- Kiela et al. (2021). Dynabench: Rethinking Benchmarking in NLP. NAACL. arXiv:2104.14337.
- Chiang et al. (2024). Chatbot Arena: An Open Platform for Evaluating LLMs by Human Preference. arXiv:2403.04132.